
We malivians have a very strange connection with the blue ocean. This ocean, seas, have been part of our culture, life and and livelihood. We have traveled across the islands in all Monsoons, seasons, day and night. It is said that maldives is a country of sea than land, and we have frequent travellers passing on the sea. About 90% of transportation and travel is done on water. Traditionally we used boats called dhoni’s and the traditional dhoni is built using coconut palm timber and this is one of the oldest known sea vessels in Maldives. In 1980’s most of these boats started becoming mechanized dhoni’s due to industrial developments.
On 31 August 2019, a family of 5 from Haa Dhaalu Atoll Nolhivaram Faru island capsized off the coast of Hanimaadhoo on a speedboat.
On this day a yellow alert was issued by the Maldives Meteorological Services (MET), when the incident occured. The national airline ‘Maldivian’ has cancelled all flights to Hanimaadhoo International Airport due to unfavourable weather as mentioned on The edition news (29 August 2019).
A cargo boat also capsized near the Taj Coral Reef resort and 3 crew was rescued, flooding in 36 islands, strong winds brought down trees, tore off roofs, damages done to households and properties in 62 islands. 14 incidents occurred due to rough seas. This cyclone Ockhi hit the southern Indian states of Kerala and Tamil Nadu as well as the Lakshwadeep islands north of the Maldives, claiming about 14 lives, according to Reuters. (Maldives Independent, 3 Dec 2017).
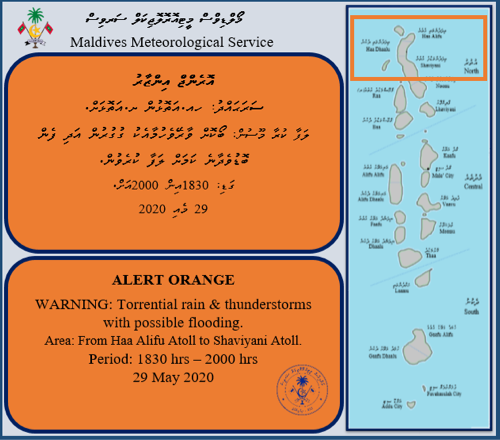
In recent years this was the first time an orange alert had been issued (15 May 2020) in Maldives, from 17:00 – 19:00 hours in the area from Baa Atoll to Faafu Atoll. This alert was issued for severe weather and it was on the third catagory of alert levels and hazards. Meteorological services started in Maldives in 1942 and from 1968, Meterological data of temperature, wind and rainfall was recorded by MET office.
This alert was issued for 34 to 40 Miles per hour . 27 stations across Maldives and 12 stations have recorded wind speeds above 41 mph, Hulhule 48 mph, Lh. Oluvelifushi 46 mph and Baa Thulhaadhoo 45 mph and we clearly see alaming numbers.
Burunu nakaiy: begins with a storm and strong winds and then becomes calm, fields are cleared, trees chopped and seeds sown. This period has always been affected by cyclone and the above mentioned bad weather is indirectly due to the current cyclone.
Moderate rough seas and sea swells are experienced near some islands in North Maldives. Many islands have reported incidents of damage, fallen trees from the heavy weather experienced during these days as mentioned on Sun online news (16 May 2020).
If we look back at freak storm data in Malé region, on 29 April 1971 41 mph, 1 May 1977, 17 May 1981 some boats in the harbour and 37 houses were damaged with 60 mph wind speed. 12 May 1989 heavy rain with 55 mph strong wind. *
Tropical Storm risk in asia-pacific (OCHA, 2011) shows tropical storm intensity based on the five wind speeds of the Saffir Simpson Hurricane Scale. North Maldives fall on zone two; 154-177 kmh and from mid towards north are on the zone one; 118-153 kmh. These zones indicate where there is a 10% probability of a storm of this intensity striking in the next 10 years.
Based on the data provided Maldives Meteorological services. UN ESCAP, UNDP, NDMC funded projects that released Buru calendar on 2010 from the project “Rakkaavethibiyya” Dhivehi Raaje. The data on the calendar is outdated but we still see a visual pattern. This calendar is based on Met data and historical monsoon calander of Nakaiy, which is an ancient calendar used in maldives and all the nakaiy is divided in to 13 or 14 days intervals. and each of these interval has a specific name and predicted weather patterns.
On this calendar, clearly we can see the temprature rise in March and April throughout the country. In Malé (Hulhule Area) wind is high on January and also there is a higher peak in early May just before the start of Hulhangu Moosun (South West Monsoon). In north Maldives wind speed increase from May till October. Also, from May the wind speed increses and it goes down in october.
Iruvai Mooson (North-East Monsoon) from Dec 10 to April 7 with nine nakaiy intervals in order (Mula, Furahalha, Uthurahalha, Huvan, Dhinasha, Hiyaviha, Furabadhuruva, Fusbadhuruva, Reyva)
Mar 26 to Apr 7 is Reyva Nakaiy, If storms occur they may be severe. Fishing is good in the north. Some trees are cut down and burnt.
Hulhangu Mooson (South-West Monsoon) its said to start from April 8 and ends in December 9 ( But in the recent years on average this monsoon is established in 20 May 2014, 13 May 2015, 9 May 2016, 16 May 2017, 11 May 2018 and 20 May 2019 ) These are the names of nakaiy intervals in order (Assidha, Burunu, Kethi, Roanu, Miyahelia, Adha, Funoas, Fus, Ahulia, Maa, Fura, Uthura, Atha, Hitha, Hey, Viha, Nora, Dosha).
Apr 8 to Apr 21 is Assidha Nakaiy, Begins with a storm, then becomes hot and dry. People allow themselves to be wet by the first rains, believing it will bring them good luck. Fishing is poor, millet and trees are planted.
Apr 22 to May 5 is Burunu Nakaiy, which begins with a storm and strong winds, then becomes calm. Fields are cleared, trees chopped and seeds sown.
May 6 to May 19 is Kethi Nakaiy, Dark clouds, frequent rains. Dried leaves are burnt and the ashes spread over the fields. Sowing continues.
Here are some of the recorded incidents :
27 February 1740, 14 December 1759, 13 December 1921, 20 October 1926 (tremor lasted about 60 seconds), 16 September 1934, 17 March 1947, 16 november 1948, 13 December 1961 and 23 May 1989 at 5:53pm at Malé (Kaafu Atoll) minor earth-tremors*
7 May 1812, Haa Alifu Atoll, Haa dhaalu Atoll, Shaviyan Atoll, Noonu Atoll and Lhaviyani Atoll in total 33 islands affected by storm*
3 Sepember 1815, Haa Alif Atoll, Haa Dhaalu Atoll and Shaviyani Feevah felt an earth tremor with loud sound heard at noon*
6 Sepember 1815, Haa Alif, Haa Dhaalu and Shaviyani Feevah felt an earth tremor with loud sound heard at sunset and disappearance of twilight. This tremor lasted an hour*
29 December 1819, Haa Alifu Atoll , Haa dhaalu Atoll, Shaviyani Atoll and Noonu Atoll in total 18 islands affected by storm*
8 December 1821, Haa Dhaalu Atoll, Shaviyani Atoll, Noonu Atoll and Baa Atoll in total 27 islands affected by storm*
25 December 1923, Heavy rain in Malé which brought flooding, trees and houses were fallen.
11 -20 october 1954, Tropical Cyclone 195502 passes below the British indian ocean territory.
9 janurary 1955, Miladhunmadulu Dhekunu (Shaviyani Atoll and Noonu Atoll ) and part of Maalhosmadulu region Raa Atoll islands damanged by a tropical cyclone.
10 November 1966, Lhaviyani Atoll Naifaru and Noonu Atoll Velidhoo felt minor earth tremors*
26 December 2004, West coast of Northern Sumatra, Indonesia. 9.1–9.3 magnitude Earthquake resulted in Tsunami which brough the biggest natural disaster to Maldives, 82 people died, 26 people still lost and from 13 islands people were relocated.
We can hear numbers but usually we can’t imagine (Here is an example for you. Magnitude 5 eathquake, Wind speed of 32 -38 mph / Wind speed 55- 63 mph). This is why visually representing infomation is important for the public. There is a lot to do and lot to develop. We already have numbers collected and we need to make sure community is out of risk at all times thoughout their lives.
My question to you is why are people not following these hazard alerts? What do we need to do and what do we need to change?
Suggested new design changes to Maldives Meteorological Services
Weather Alerts on Social networks.
This system is design based on a question.
While an alert is brought by MET service, the infomation given needs to be easy, clean, simplified and easy to identify and navigate. By using this method the alert infomation takes less time to take action. Also, making sure that everyone can understand this system visually.
How this sugested method works

We always love simple geometry and simple shapes. These alerts on social networks have done a great job for years and its time to make some changes for future.
In my opinion, the old representation given below makes the viewer confused as it is based on a lot of text and round curve boxes.
Visual representaions of hazards.
Visual represention of these icons and promoting them is required. Its imaportant for the people viewing and to grasp the type of hazards at first glance rather than reading from sentences. This saves a lot of time for the viewer and gives a better reaction and response.
Some common types of hazards found in Maldives.

Maldives Meteorological Services (MET) currently collects data from 27 stations across the country. With those data it would always be great to provide extra predictions. Here are some hazards found in maldives with some extra hazards that, in my view, if these infomation can be provided would be great for public to get prepared for future hazards.
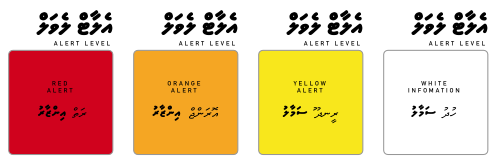
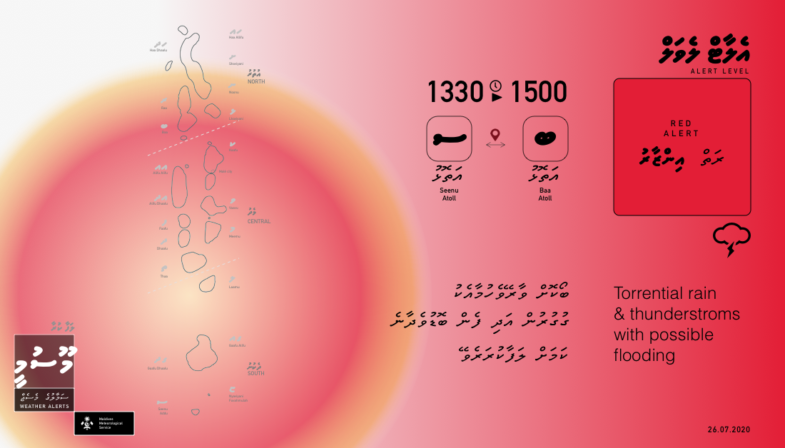
Color coding hazard levels
Color coding should be used according to the importance of the hazard.
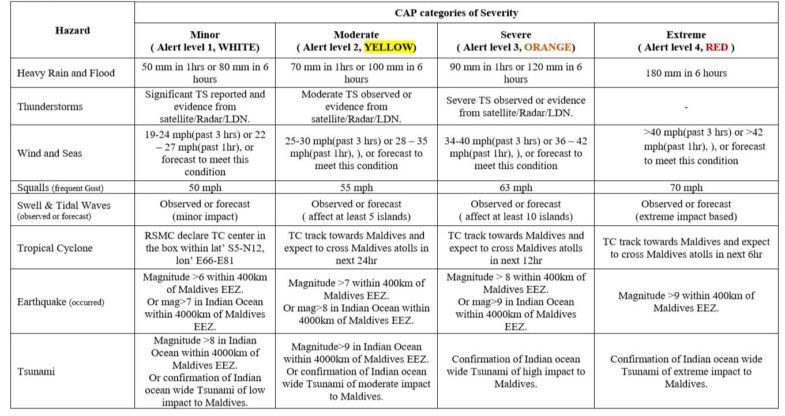
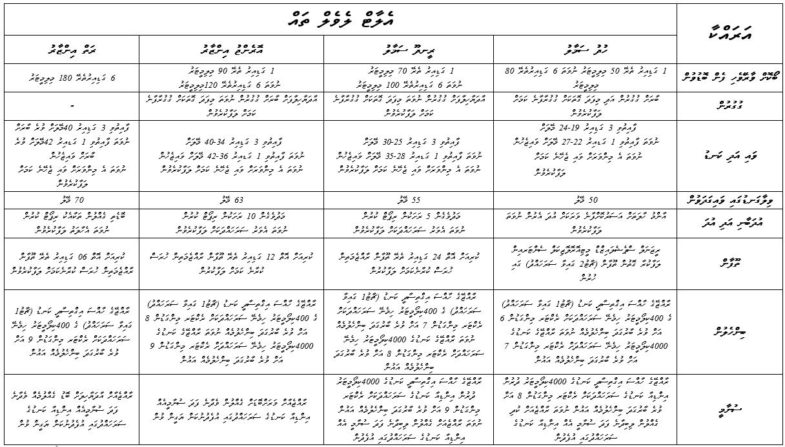
Maldives Meteorology service of Maldives has a customized table representation of common hazards in Maldives, this table is developed to represent the hazards category severity and hazard thresholds. With visual representation and color coding would be a proper way of describing the hazard, its levels and it makes it easy for the public to identify and react to the published infomation
Also I have used “thin font” text is used to represent the color for color blind people and “bold font” text to represent the action that is required to be taken once the alert is released.
Alert levels and hazard thresholds.
Area

Using the commonly used location icon, people looking at the post can easly navigate where the alert is released.
(1) The first method can be used to identify specific atoll regions in maldives. For example the alert is released for Baa Atoll to Seenu Atoll. Rather than writing the full atoll name its easy to go with the dhivehi letter reprenting the atoll, these are the commonly used letters currentlly representing our atolls.
(2) This method can be used to identify areas rather than going to individual atolls.
(3) The last method can be used to alert through out the country
Period

Period of relesed alert or time is repesented with an icon of “clock” with a trangle “play / arrow head” icon. This would make sure people know that the alert is released for specific period.
As arrow head shows direction, time is represented from left to right.
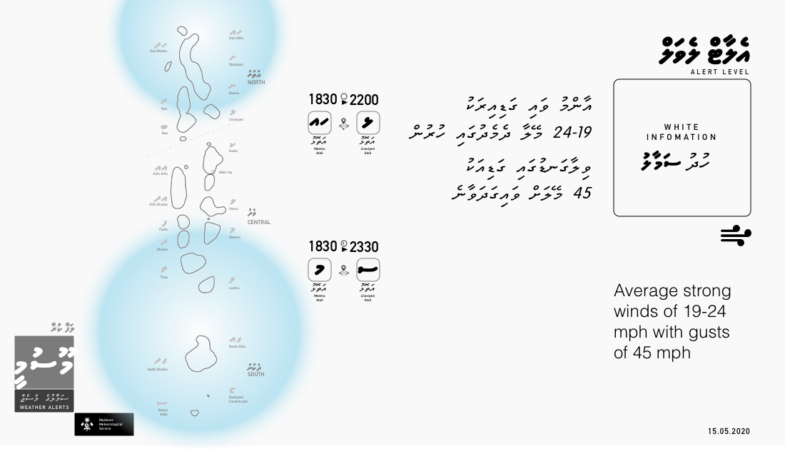
Suggested new design to represnt the Hazard Alerts


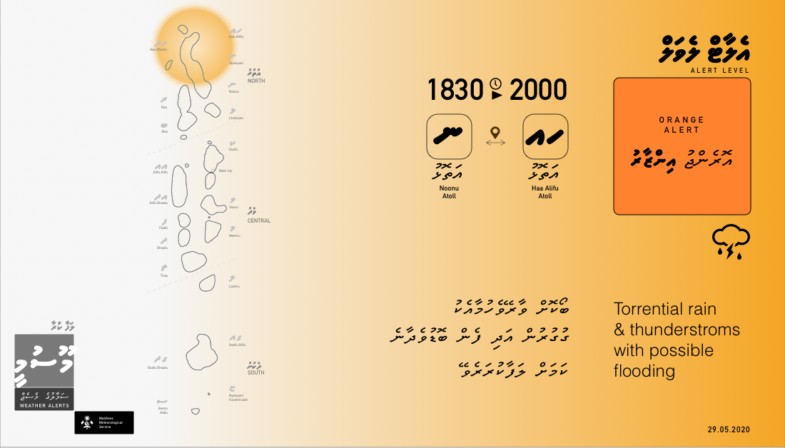
In an ideal world, multiple alerts at a time can be possible. This method can represent multiple alerts at once.
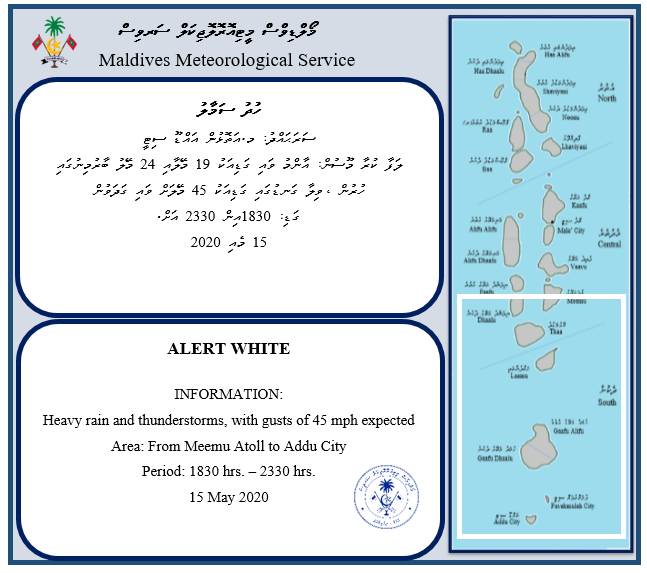
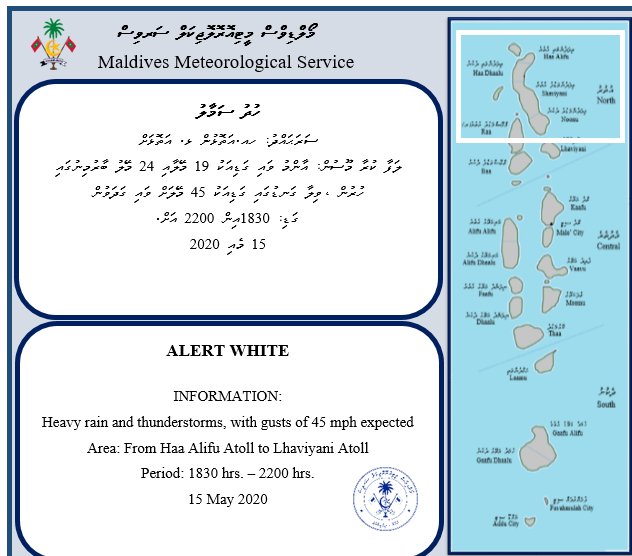
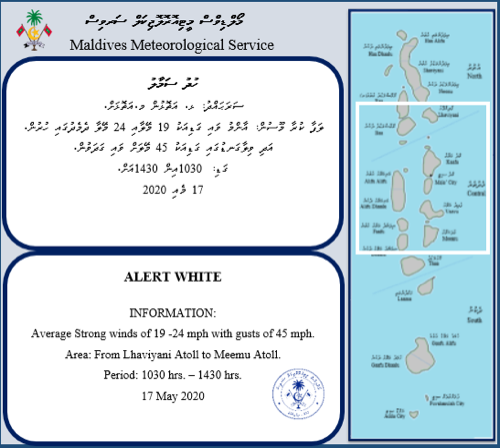
Above Example : 15 May 2020: Two white alerts in effect for average strong winds
Haa Alifu to Lhaviyani – Valid till 2200
Meemu to Addu city Valid til 2300
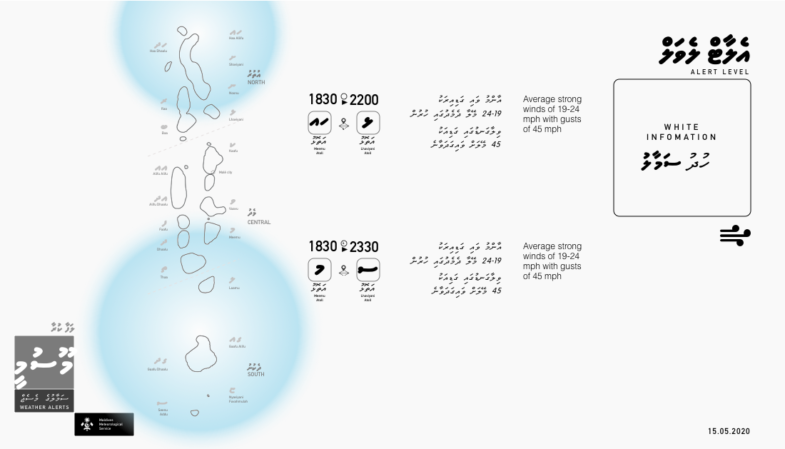
If the details given are simliar we can use this method represented in diagram
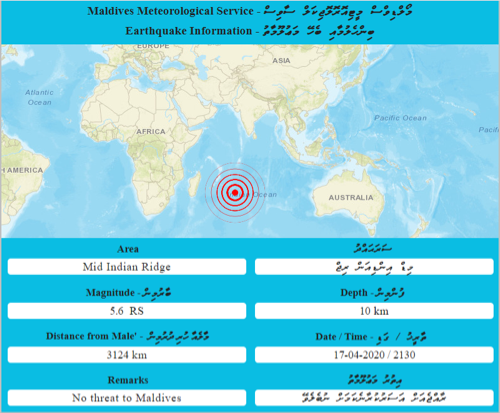
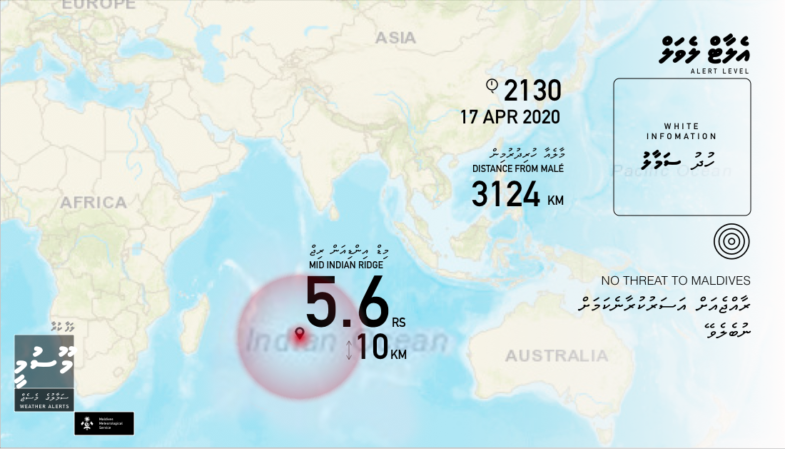
Earthquake:
Other Suggestions
– Use single map to represent places. (MET service have been using mutiple maps to represent earthquake infomation)
– Verify the page and stop repeatedly using Maldives seal.
– Try to implement an automated system to generate these alerts, this would save a lot of time.
– Implement QR Code system to link these alerts to other platforms and news briefs for media.
DOWNLOAD PDF: Suggested new design changes to Maldives Meteorolofical ServicesWeather Alerts on Social networks.
References:
*Changes in the topography of Maldives, Hassan Ahmed Manik, 1990
– The edition news by Ahmed Aiham on 29 August 2019
– Sun online news by Najah Masood on 16 May 2020
– Nakaiy- Monsoon – elysianmaldives.com
– Maldives: Damage to 60 islands after extreme weather, Maldives Independent on 3 Dec 2017
ICONS Created by Template, Muammar Khalid, Ema Dimitrova, Emma Mitchell, Ed Harrison, Harry Pang, Austin Condiff, Maxicons, P Thanga Vignesh from the Noun Project